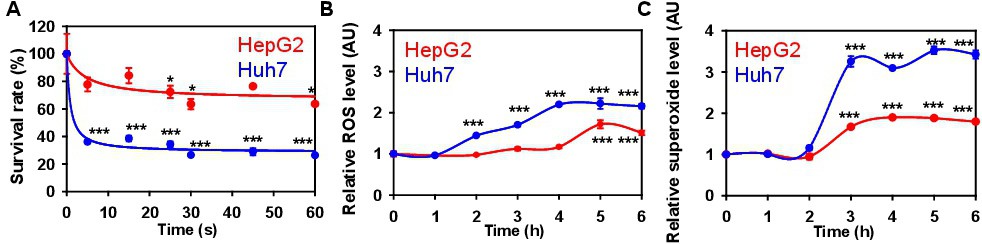
Fig. 2. NTP induces ROS production in HCC cell lines. (A) Cell viability of Huh7 and HepG2 was analysed by WST-1 assay 72 h post plasma treatment. The data were normalized to control values (no exposure), which were set as 100 % cell viability. Readings were done in quadruplicates, data are present as mean ± SEM, n=3 (three independent experiments). One-way ANOVA with Newman-Keuls multiple comparison test was used; t=0 time point serving as control; *P< 0.05, ***P< 0.001. (B) Time-dependent ROS/RNS (after 60s NTP) induction by NTP. Huh7 and HepG2 cells were exposed to NTP, followed by ROS measuring, using the cellular ROS/RNS detection kit (Abcam) by spectrofluorometry. Readings were done in quadruplicates, data are present as mean ± SEM, n = 3 (three independent experiments). One-way ANOVA with Newman-Keuls multiple comparison test was used; t = 0 time point serving as control, ***P< 0.001. (C) Time-dependent (after 60s NTP) Superoxide (O2-) induction by NTP. Huh7 and HepG2 cells were exposed to NTP, followed by superoxide measuring, using the cellular ROS/Superoxide Detection Assay Kit (Abcam) by spectrofluorometry. Readings were done in quadruplicates, data are present as mean ± SEM, n = 3 (three independent experiments). One-way ANOVA with Newman-Keuls multiple comparison test was used; t = 0 time point serving as control, ***P< 0.001.